No edit summary |
No edit summary |
||
| Line 16: | Line 16: | ||
| label3 = Sub-Category | data3 = Biomass | | label3 = Sub-Category | data3 = Biomass | ||
| label4 = Editable | data4 = No | | label4 = Editable | data4 = No | ||
| label5 = | | label5 = Data source | data5 = Ecosystem simulation (EwE) | ||
| header7 = Major Impacts | | header7 = Major Impacts | ||
| data8 = [[(NS | | data8 = [[(NS)Noise]] | ||
| data9 = [[(NS | | data9 = [[(NS)Industrial and Pelagic Trawl Catch]] | ||
}} | }} | ||
Revision as of 21:41, 13 April 2018
 | |
| Layer Info | |
|---|---|
| Category | Ecology |
| Sub-Category | Biomass |
| Editable | No |
| Data source | Ecosystem simulation (EwE) |
| Major Impacts | |
| (NS)Noise | |
| (NS)Industrial and Pelagic Trawl Catch | |
Description:
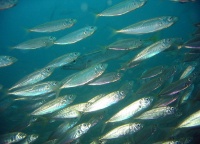
Mackerel is a common name applied to a number of different species of pelagic fish, mostly, but not exclusively, from the family Scombridae. They are found in both temperate and tropical seas, mostly living along the coast or offshore in the oceanic environment.
Mackerel typically have vertical stripes on their backs and deeply forked tails. Many species are restricted in their distribution ranges, and live in separate populations or fish stocks based on geography. Some stocks migrate in large schools along the coast to suitable spawning grounds, where they spawn in fairly shallow waters. After spawning they return the way they came, in smaller schools, to suitable feeding grounds often near an area of upwelling. From there they may move offshore into deeper waters and spend the winter in relative inactivity. Other stocks migrate across oceans.
@Wikipedia
MSP Challenge 2050:
In the MSP Challenge Game the Mackerel population is part of the Ecological model, driven by Ecopath with Ecosim.
Impact from different pressures:
The following table shows the impact different pressures have on the Mackerel biomass.
| Pressure | Impact |
|---|---|
| Noise | 1: low impact |
| Surface Disturbance | 0: no impact |
| Bottom Disturbance | 0: no impact |
Impact from different fleets:
The following table shows the t/km2 mackerel the different fleets catch.
| Fleet | t/km2 |
|---|---|
| Bottom Trawl | 0,008 |
| Industrial and Pelagic Trawl | 0,210 |
| Drift and Fixed Nets | 0,000 |
Fish Impact Diagram:
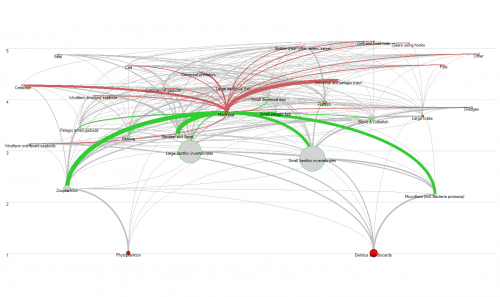
The following diagram displays the impact on (red) and the impact from (green) mackerel on fleets and other biomass.
NO VIDEO AVAILABLE

 Co-funded by the European Union.