(Created page with " <ul class="nav nav-tabs"> <li class="active"><btn data-toggle="tab" class="">#tab1|General Information</btn></li> <li><btn data-toggle="tab" class="">#tab2|Additional...") |
No edit summary |
||
| Line 12: | Line 12: | ||
| title = Shipping Intensity | | title = Shipping Intensity | ||
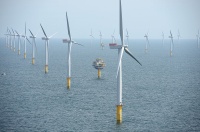
| image = [[File:Wind_Farm_Example.jpg|200px]] | | image = [[File:Wind_Farm_Example.jpg|200px]] | ||
| header1 = Layer Info | | header1 = Layer Info | ||
| label2 = Category | data2 = Activities | | label2 = Category | data2 = Activities | ||
| Line 20: | Line 19: | ||
| label6 = Geometry Type | data6 = Raster | | label6 = Geometry Type | data6 = Raster | ||
| label7 = Period | data7 = Month | | label7 = Period | data7 = Month | ||
| header10 = Types | | header10 = Types | ||
| data11 = Low | | data11 = Low | ||
| data12 = Medium Low | | data12 = Medium Low | ||
Revision as of 14:32, 7 March 2018
MSP Challenge 2050:
The MSP Challenge Game simulates shipping intensity between a starting position and a destination, these intensities are stored and represented in the form of a raster file.
PRESSURES
| HEADER NAME 1 | HEADER NAME 2 | HEADER NAME 3 |
|---|---|---|
| Data | Data | Data |
| Data | Data | Data |
"ON THIS TAB VISUAL CONTENT IS PLACED"
This page was last edited on 7 March 2018, at 14:32. Content is available under GPLv3 unless otherwise noted.

 Co-funded by the European Union.