No edit summary |
No edit summary |
||
| Line 3: | Line 3: | ||
<li class='active'><btn data-toggle='tab' class=''>#tab1|General Information</btn></li> | <li class='active'><btn data-toggle='tab' class=''>#tab1|General Information</btn></li> | ||
<li><btn data-toggle='tab' class=''>#tab2|Additional Information</btn></li> | <li><btn data-toggle='tab' class=''>#tab2|Additional Information</btn></li> | ||
<li><btn data-toggle='tab' class=''>#tab5|Meta Data</btn></li> | |||
</ul> | </ul> | ||
| Line 55: | Line 57: | ||
</div> | </div> | ||
<div id='tab5' class='tab-pane fade'> | |||
===Retrieved from:=== | |||
N/A | |||
===Description:=== | |||
N/A | |||
</div> | |||
</div> | </div> | ||
Revision as of 10:29, 7 November 2019
| Layer Info | |
|---|---|
| Category | Shipping |
| Editable | No |
| Data source | Shipping simulation |
| Values | |
| Low | |
| Medium Low | |
| Medium | |
| Medium High | |
| High | |
| EXTREME | |
Description:
Shipping concerns transport by sea, involving ships or vessels transporting people (passengers) and/or goods (cargo). Shipping may be for commerce, recreation, or for military purposes. Merchant shipping is the lifeblood of the world economy, carrying 90% of international trade with 102,194 commercial ships worldwide.
MSP Challenge 2050:
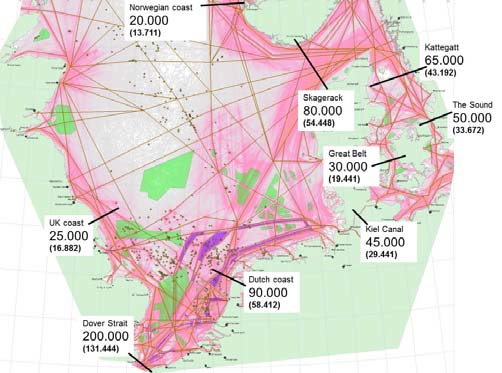
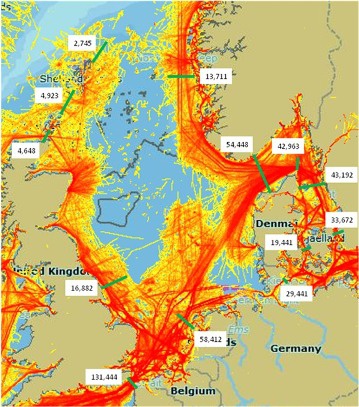
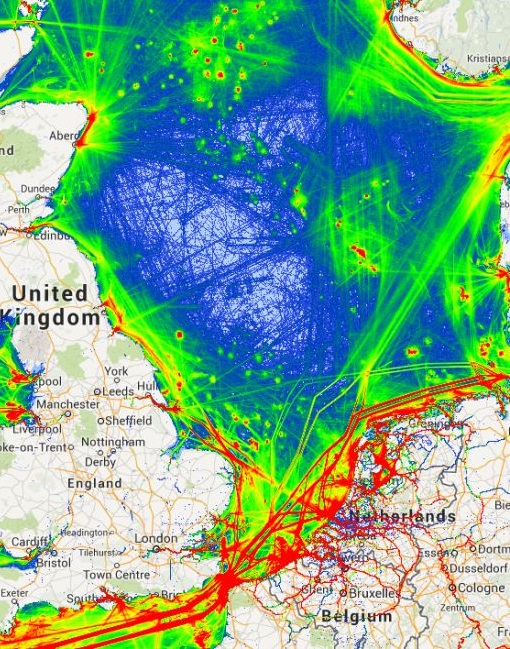
Shipping Intensity is a month-by-month, computer generated data layer showing a 'heat map' of all ship traffic combined. The layer combines the tanker, cargo, passenger and ferry intensity heat maps together. Therefore this layer provides a complete overview of all simulated ship traffic within as well as in and out of the North Sea region.
The shipping simulation follows this logic:
- Month by month, tanker, cargo, passenger and ferry ships want to go from specific ports to specific ports, within as well as in and out of the North Sea region.
- These ships find a safe yet short route for their travels. Ideally they move in a straight line. To ensure the route is safe, they will opt for deeper waters and designated shipping lanes applicable to their type.
- More ships following the same route means a higher intensity of ships that month, and thus redder lines on the intensity 'heat map' layers.
ON THIS TAB VISUAL CONTENT IS PLACED
Retrieved from:
N/A
Description:
N/A


 Co-funded by the European Union.